Quarterly report Q2 2025

Press release
24 juli 2025

Heerlen/Amsterdam, 24 July 2025.

  • Current funding ratio rises to 117.5 per cent in Q2
  • Second quarter investment return: 0.3% (€ 1.8 billion)
  • Pension liabilities fall to €444 billion in Q2
  • Policy funding ratio falls to 113.7 per cent in Q2

ABP’s financial position improved in the second quarter of 2025. The current funding ratio rose from 115.6 per cent at the end of March 2025 to 117.5 per cent at the end of June 2025. The increase in interest rates caused the fund’s pension liabilities to fall from € 450 billion to € 444 billion. ABP’s assets rose slightly to € 522 billion.

Chairman of the Board Harmen van Wijnen: “In the second quarter of this year, the turmoil in the world and financial markets continued. It is therefore important that ABP protects the pension assets. ABP’s investment portfolio is built to cope with shocks. We invest in a diversified way across the world in different types of investments and with a long-term perspective. At the same time, interest rates have a major impact on the funding ratio. The fact that the funding ratio improved in the second quarter was therefore partly due to the slightly higher interest rates. ABP is also working hard to switch to the new pension scheme in 2027, so that we can continue to provide our participants with a pension offering the highest possible purchasing power and stability in the future.”

What can ABP participants expect?

At the end of November this year, ABP will assess whether and how much pensions can be increased in 2026. The fund will look at the financial position at the end of October and the price increase between September 2024 and September 2025. The Board will determine whether and to what extent an increase is appropriate. In doing so, the Board will take the interests of all groups of participants into account.

ABP’s second quarter 2025 funding ratios

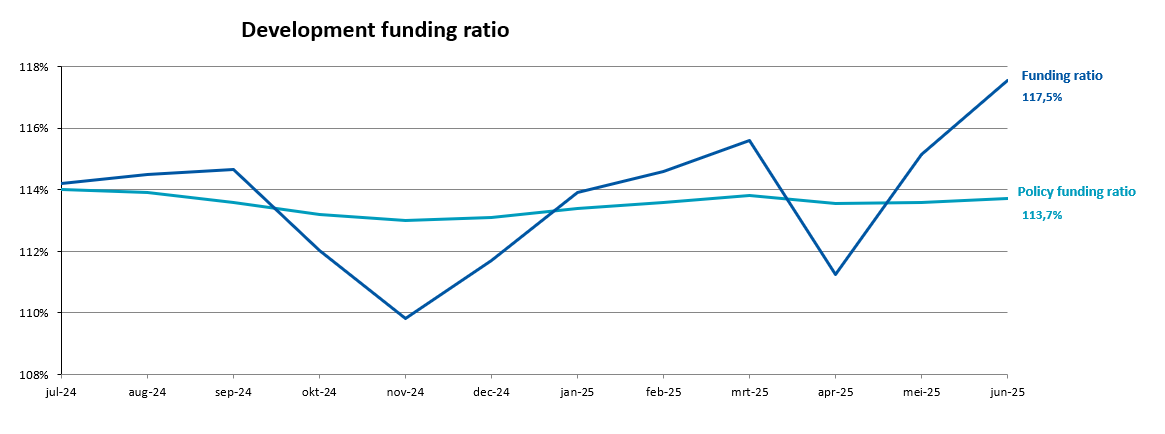
In the second quarter of 2025, the current funding ratio rose from 115.6 per cent to 117.5 per cent. This was partly due to the slightly higher interest rates. The policy funding ratio (the average of the current funding ratios over the last twelve months) fell slightly by 0.1 per cent in the second quarter: from 113.8 per cent to 113.7 per cent.

What did ABP’s investments and liabilities do in Q2 2025?

ABP’s available assets increased from € 520 billion in the first quarter to € 522 billion at the end of June 2025. ABP posted a return of 0.3 per cent (€ 1.8 billion) in the second quarter. A number of asset classes recorded losses, such as alternative investments and real estate, while fixed-income investments and equities posted positive returns (see appendix). The actuarial interest rate rose to 2.7 per cent in the second quarter. As a result, the value of the pensions that ABP must pay out now and in the future fell by € 6 billion to € 444 billion at the end of June 2025.

Key figures
 Q2 2024Q3 2024Q4 2024Q1 2025Q2 2025
Current funding ratio (%)115.6114.6111.7 **115.6117.5
Policy funding ratio (%)114.2113.6113.1113.8113.7
Available assets (€ billion) *510533542 **520522
Liabilities (€ billion)441465486450444
Actuarial interest rate (%)2.52.22.12.62.7

* The main reasons for the change in available assets are achieved investment returns, premiums and distributions.
** In the above table, some key figures of Q4 2024 have been adjusted as a result of the determination of and in accordance with the final financial statements for 2024. The appendix on the composition and return of the investment portfolio also shows a number of changes.

Visual representation of coverage rates per month, with figures available in the table 'Development funding ratio' below.

Development funding ratio
 Current funding ratioPolicy funding ratio
July 2024114.2114.0
August 2024114.5113.9
September 2024114.6113.6
October 2024112.0113.2
November 2024109.8113.0
December 2024111.7113.1
January 2025113.9113.4
February 2025114.6113.6
March 2025115.6113.8
April 2025111.2113.6
May 2025115.2113.6
June 2025117.5113.7
Appendix: Notes on return on ABP Investment Portfolio
 Weighting in %Return in % in Q2 2025Return in billion € in Q2 2025Return in % in YTD 2025Return in billion € in YTD 2025;Return in % in 2024Return in billion € in 2024
Fixed-income investments (total)40.20.40.8-0.6-1.2-0.2-0.3
Government bonds10.01.20.60.70.40.60.3
Long-term government bonds12.9-0.2-0.1-3.5-2.4-6.4-4.4
Corporate bonds10.81.40.82.41.43.11.7
Emerging market bonds5.0-2.1-0.6-2.6-0.76.41.8
Mortgages1.61.50.11.00.16.80.3
Equities (total)30.02.74.6-2.9-4.221.929.9
Developed market equities25.82.73.9-3.7-4.523.625.2
Emerging market equities4.13.20.71.30.315.84.7
Alternative investments (total)19.3-4.3-4.6-5.6-6.013.012.8
Private Equity8.6-5.1-2.4-8.8-4.311.85.3
Commodities *3.8-5.9-1.3-3.8-0.819.74.3
Infrastructure6.3-1.8-0.6-1.2-0.410.43.0
Hedge funds (in run-off) **0.6-9.3-0.3-12.1-0.46.60.3
Real estate9.3-3.1-1.6-5.8-3.05.52.7
Portfolio return (for overlay)98.8-0.1-0.7-2.7-14.49.045.1
Overlay *** (total)1.2 0.52.5-1.0-5.7-0.7-3.4
Interest rate and inflation hedge *** -0.3-1.7-2.2-11.90.21.0
Currency hedge *** 0.73.91.15.9-0.9-4.5
Cash and other *** 0.10.30.10.30.00.1
Total100.00.31.8-3.7-20.08.441.7

* Commodities have 100% USD exposure, expressed in USD the return over Q2 is +2.2%
** Hedge funds have 100% USD exposure, expressed in USD the return over Q2 is -1.4%
*** contribution to total return

Notes on return on investment portfolio

ABP’s investment portfolio achieved a return (for overlay) of -0.1 per cent for the second quarter of 2025; in euros, this investment result is -€ 0.7 billion. The total return (including overlay) for the second quarter was +0,3 per cent, in euros this is +€ 1.8 billion.